User Guide
The Terminal User Interface (TUI) transforms kubefwd into an interactive development companion. Browse namespaces, select services, monitor traffic, and stream logs—all from your terminal.
Launching kubefwd
Idle Mode (Recommended)
Start without pre-specified services and add them interactively:
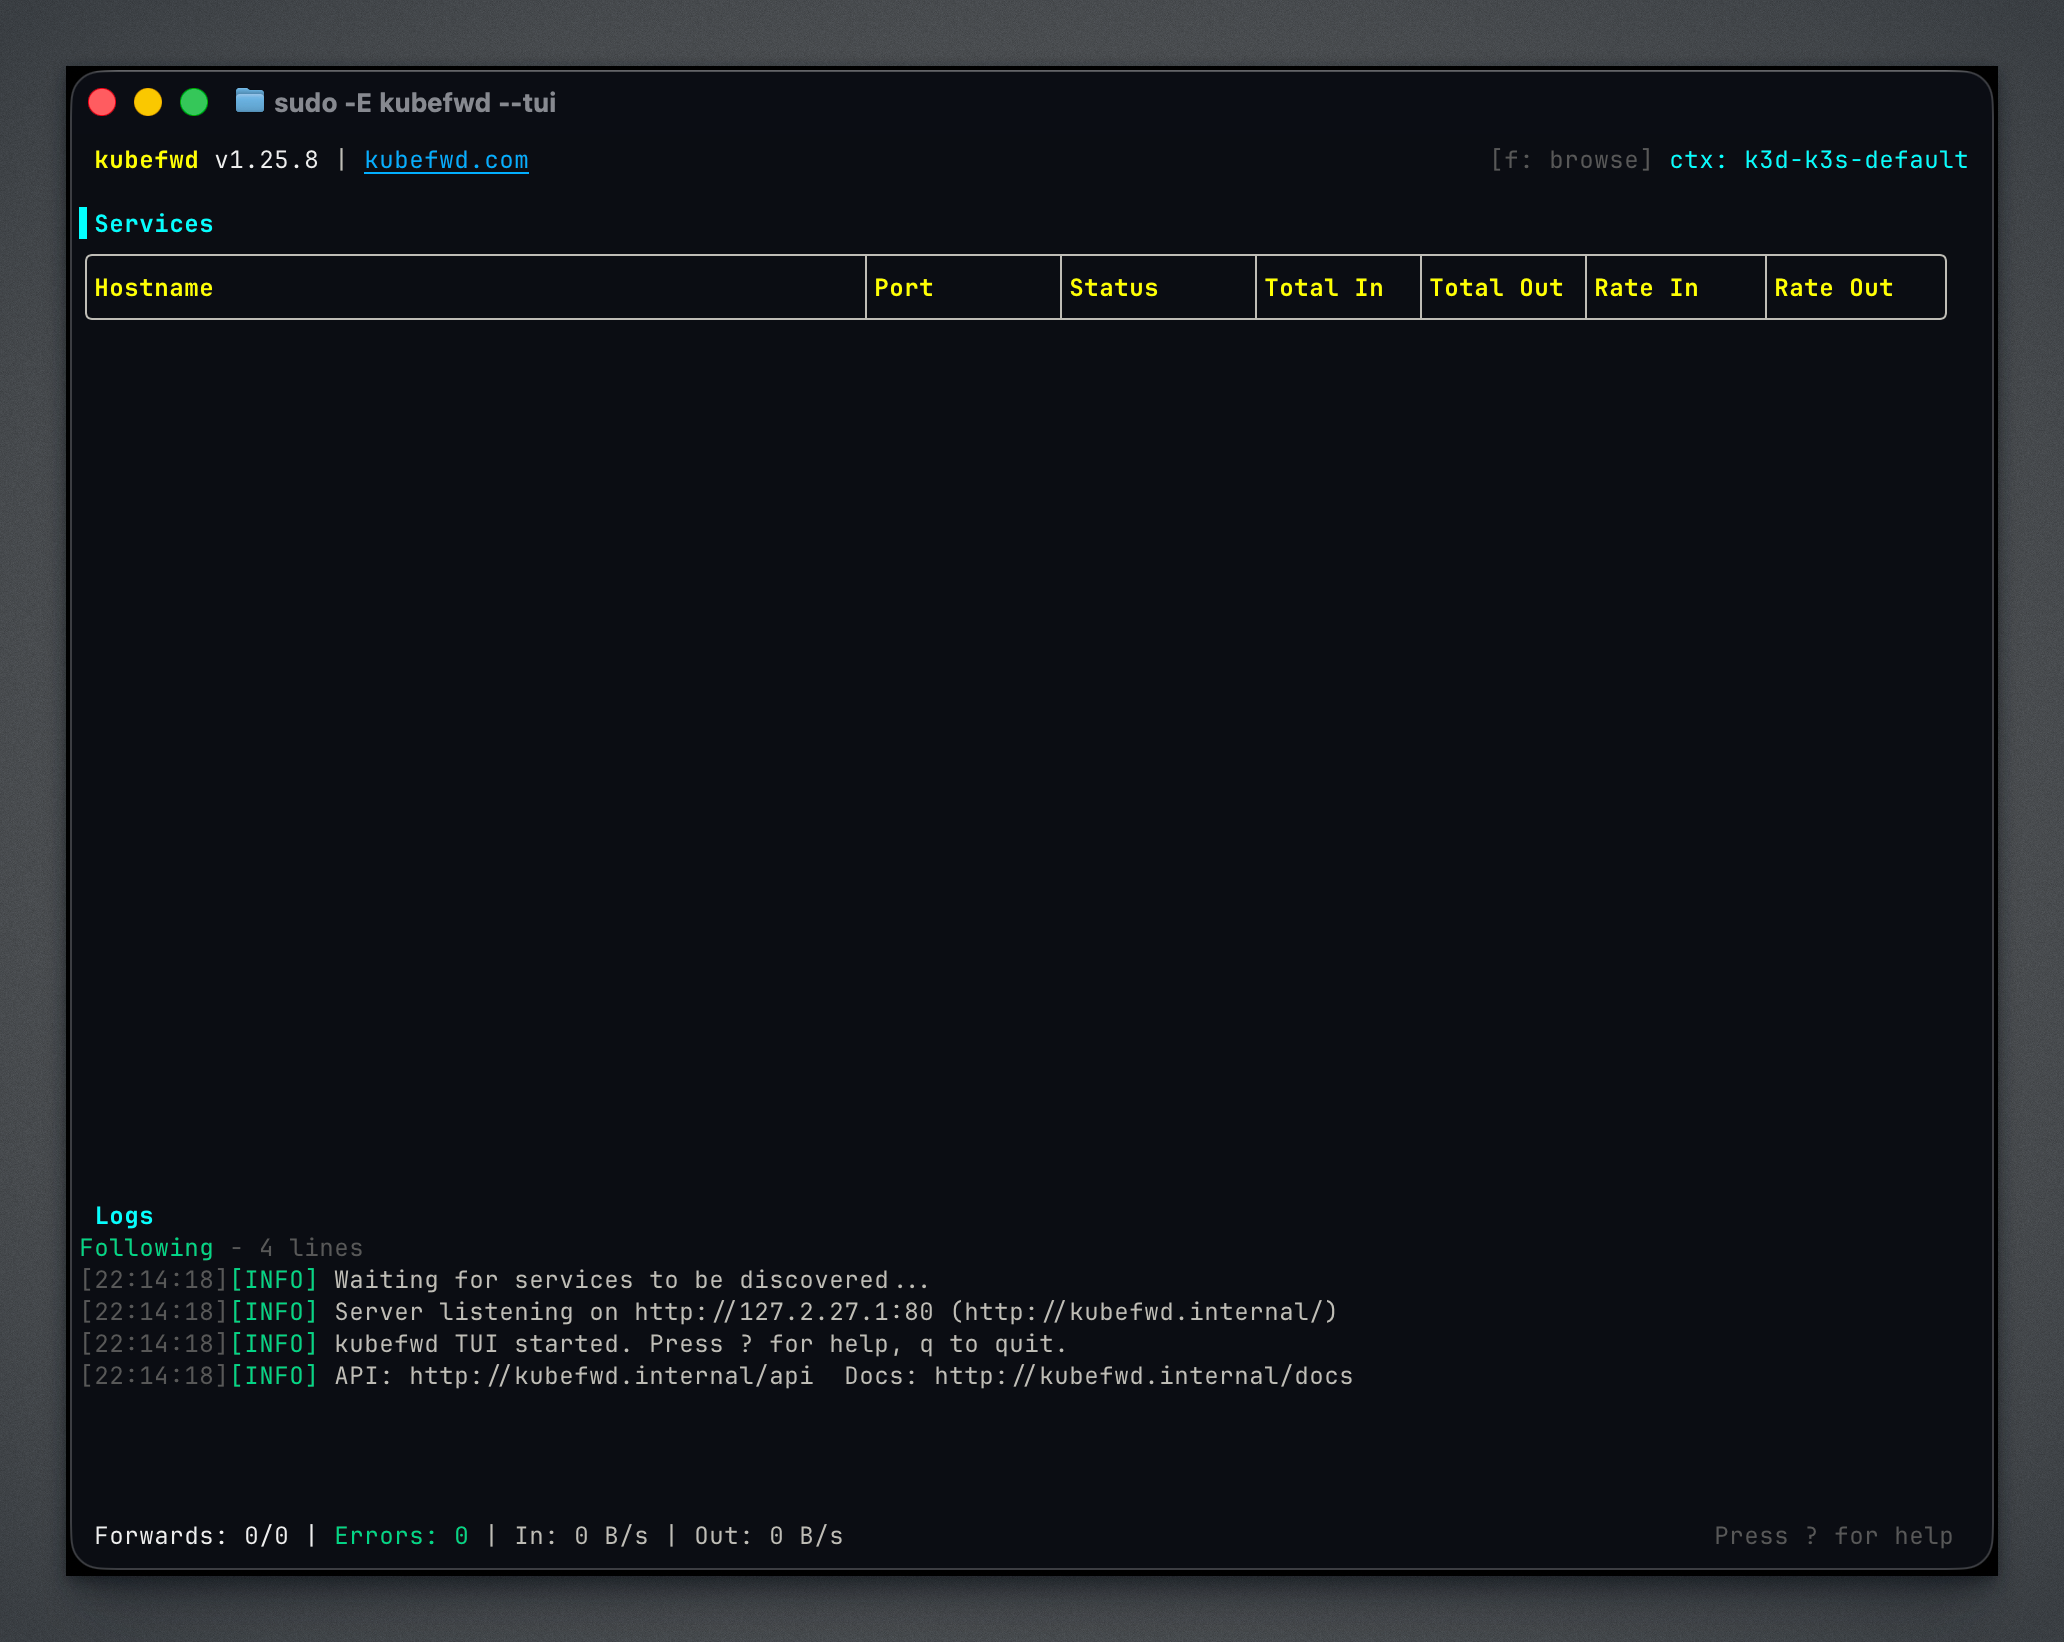
In Idle Mode, you start with an empty service list and use the built-in browsers to discover and forward services as needed. The REST API and auto-reconnect are enabled by default.
Classic Mode
Forward all services in a namespace immediately:
Services appear in the TUI as they're discovered and forwarded.
Multi-Namespace
Forward from multiple namespaces:
Interface Overview
The TUI consists of several panels that provide different views of your forwarded services.
Main View
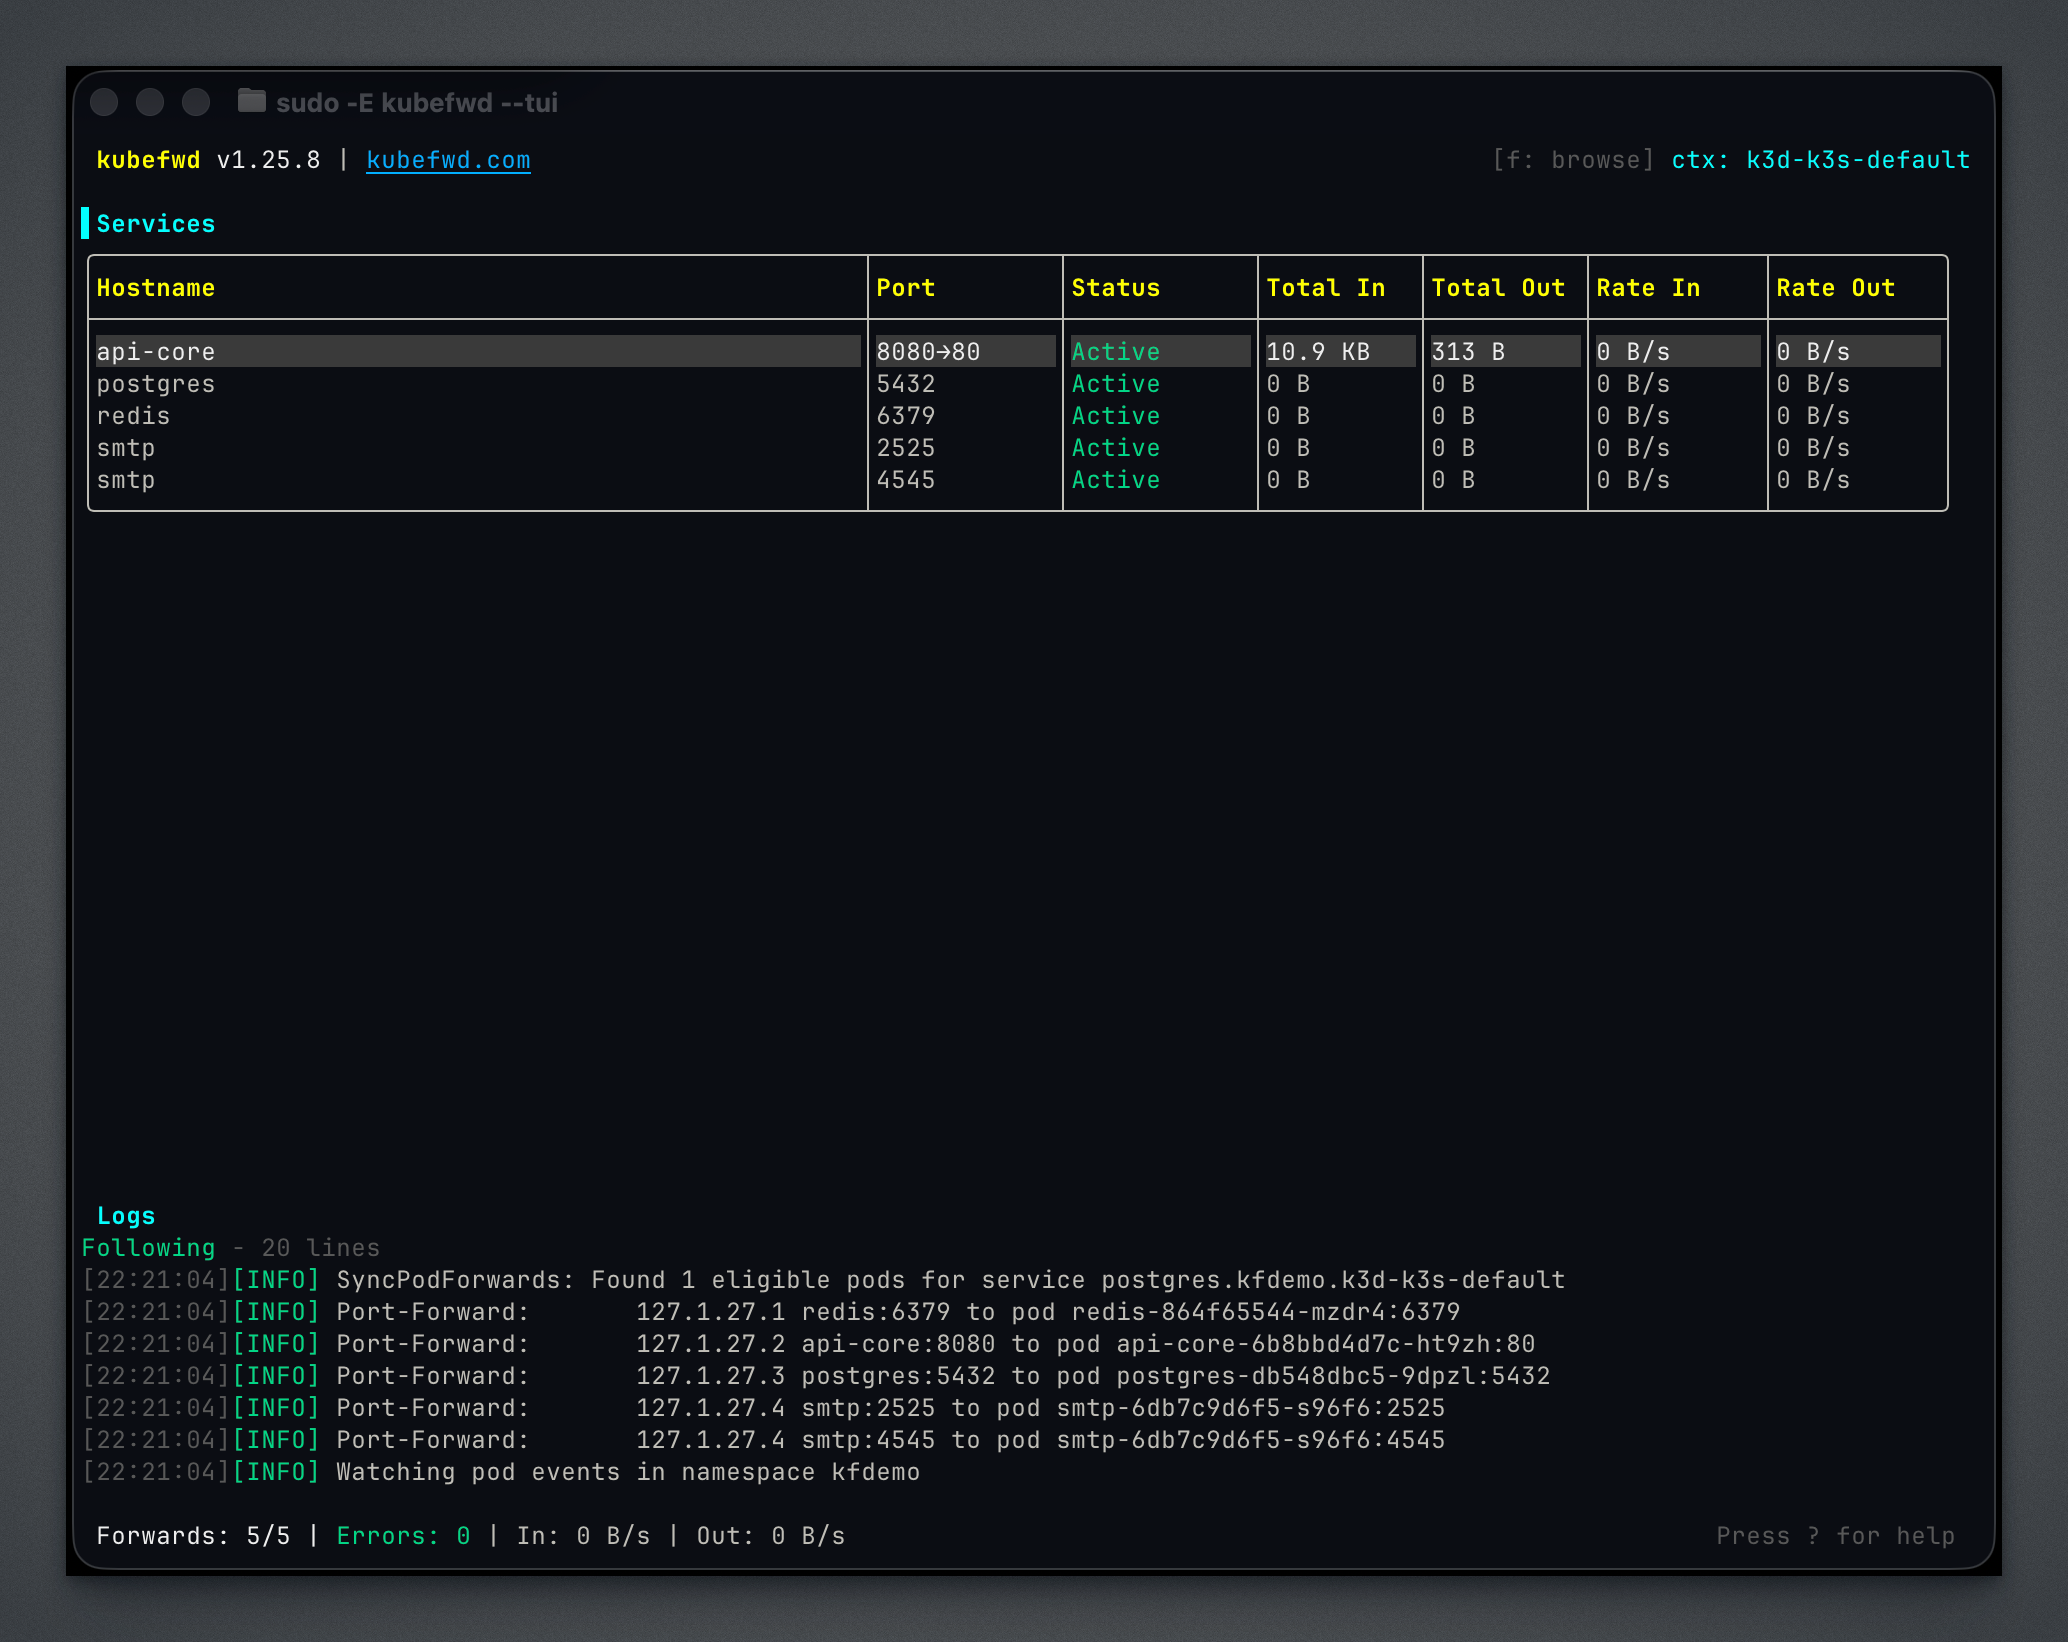
The main view shows:
| Panel | Description |
|---|---|
| Services | All forwarded services with status, namespace, local address, and traffic |
| Logs | Real-time kubefwd activity, connection events, and errors |
| Status Bar | Service counts, current filter, and keyboard hints |
Service Status Indicators
| Indicator | Meaning |
|---|---|
| Green dot | Active and forwarding |
| Yellow dot | Connecting or reconnecting |
| Red dot | Error state |
Help Overlay
Press ? to see all available keyboard shortcuts:

Namespace Browser
Press f to open the namespace browser. This modal lets you explore your cluster and select what to forward.

Navigation
| Key | Action |
|---|---|
j / ↓ |
Move down |
k / ↑ |
Move up |
Enter |
Select namespace and open service browser |
Esc |
Close browser |
Namespaces already being forwarded are marked.
Service Browser
After selecting a namespace, the service browser shows available services:

Actions
| Key | Action |
|---|---|
j / ↓ |
Move down |
k / ↑ |
Move up |
Space |
Toggle selection for current service |
a |
Select all services in namespace |
Enter |
Forward selected services |
Esc |
Close without forwarding |
Services already being forwarded are marked.
Context Switching
Press x to switch between Kubernetes contexts. After selecting a new context, press f to browse namespaces in that cluster.
Detail View
Press Enter on any service to open the detail view. The detail view has three tabs.
Info Tab
Connection details, hostnames, and traffic statistics:
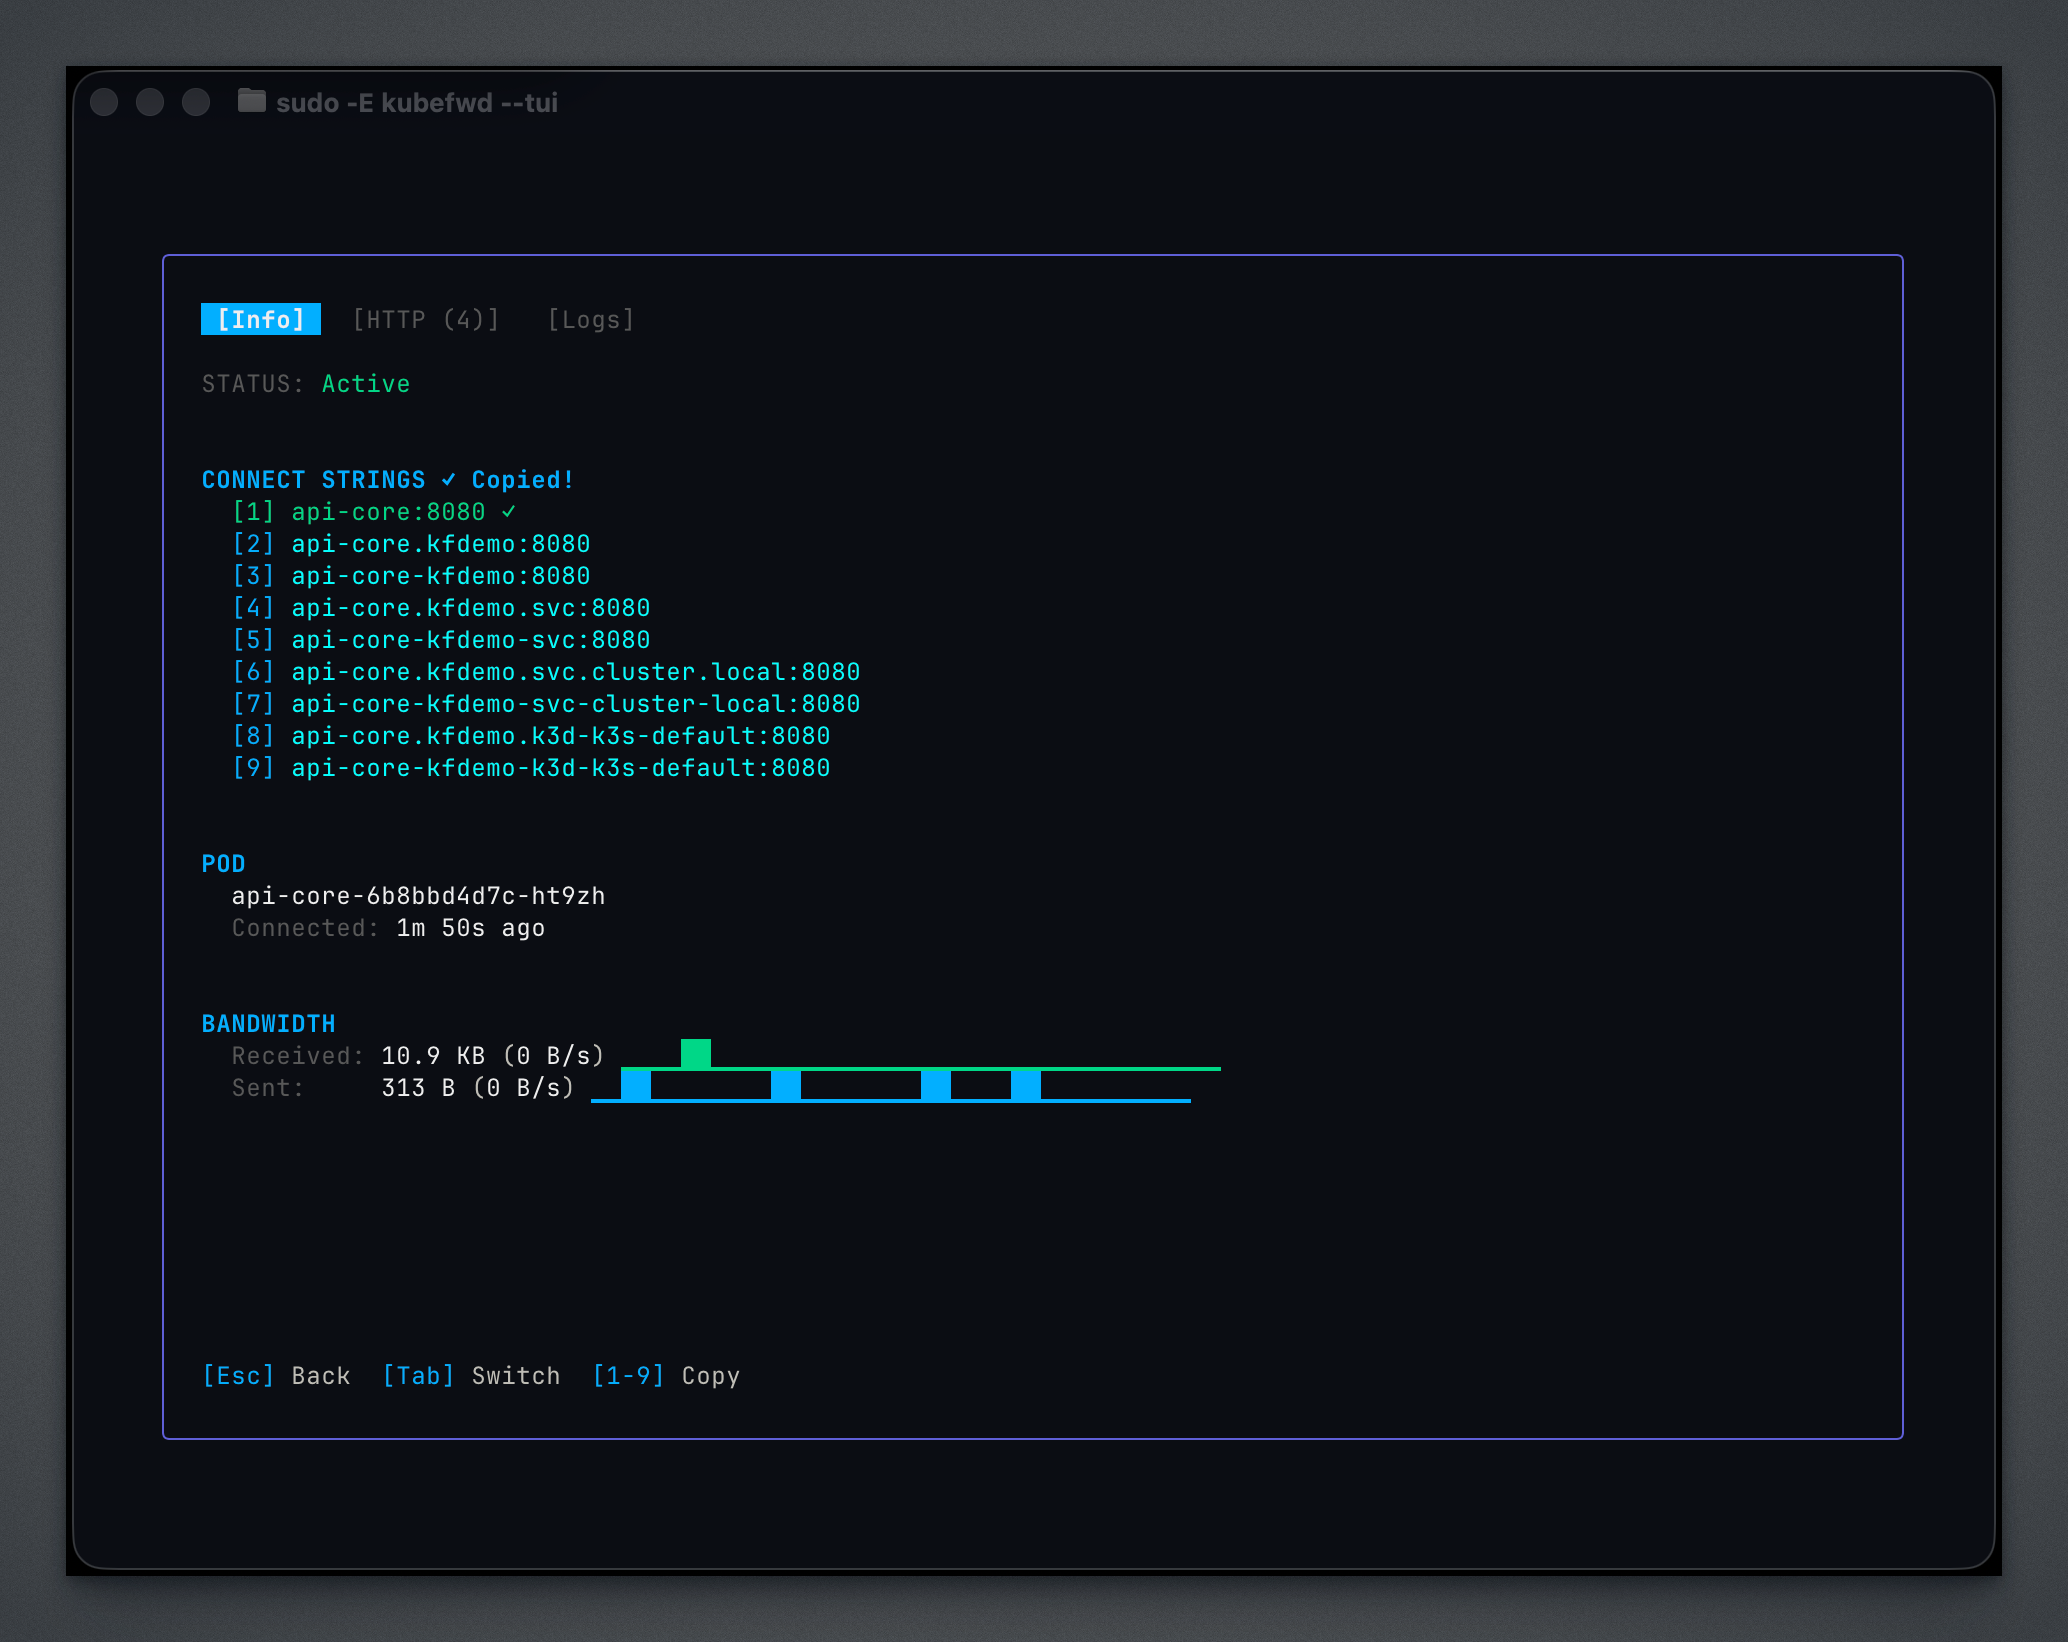
Copy connection strings: Press 1, 2, or 3 to copy the corresponding connection string to your clipboard.
Logs Tab
Live pod output streaming:
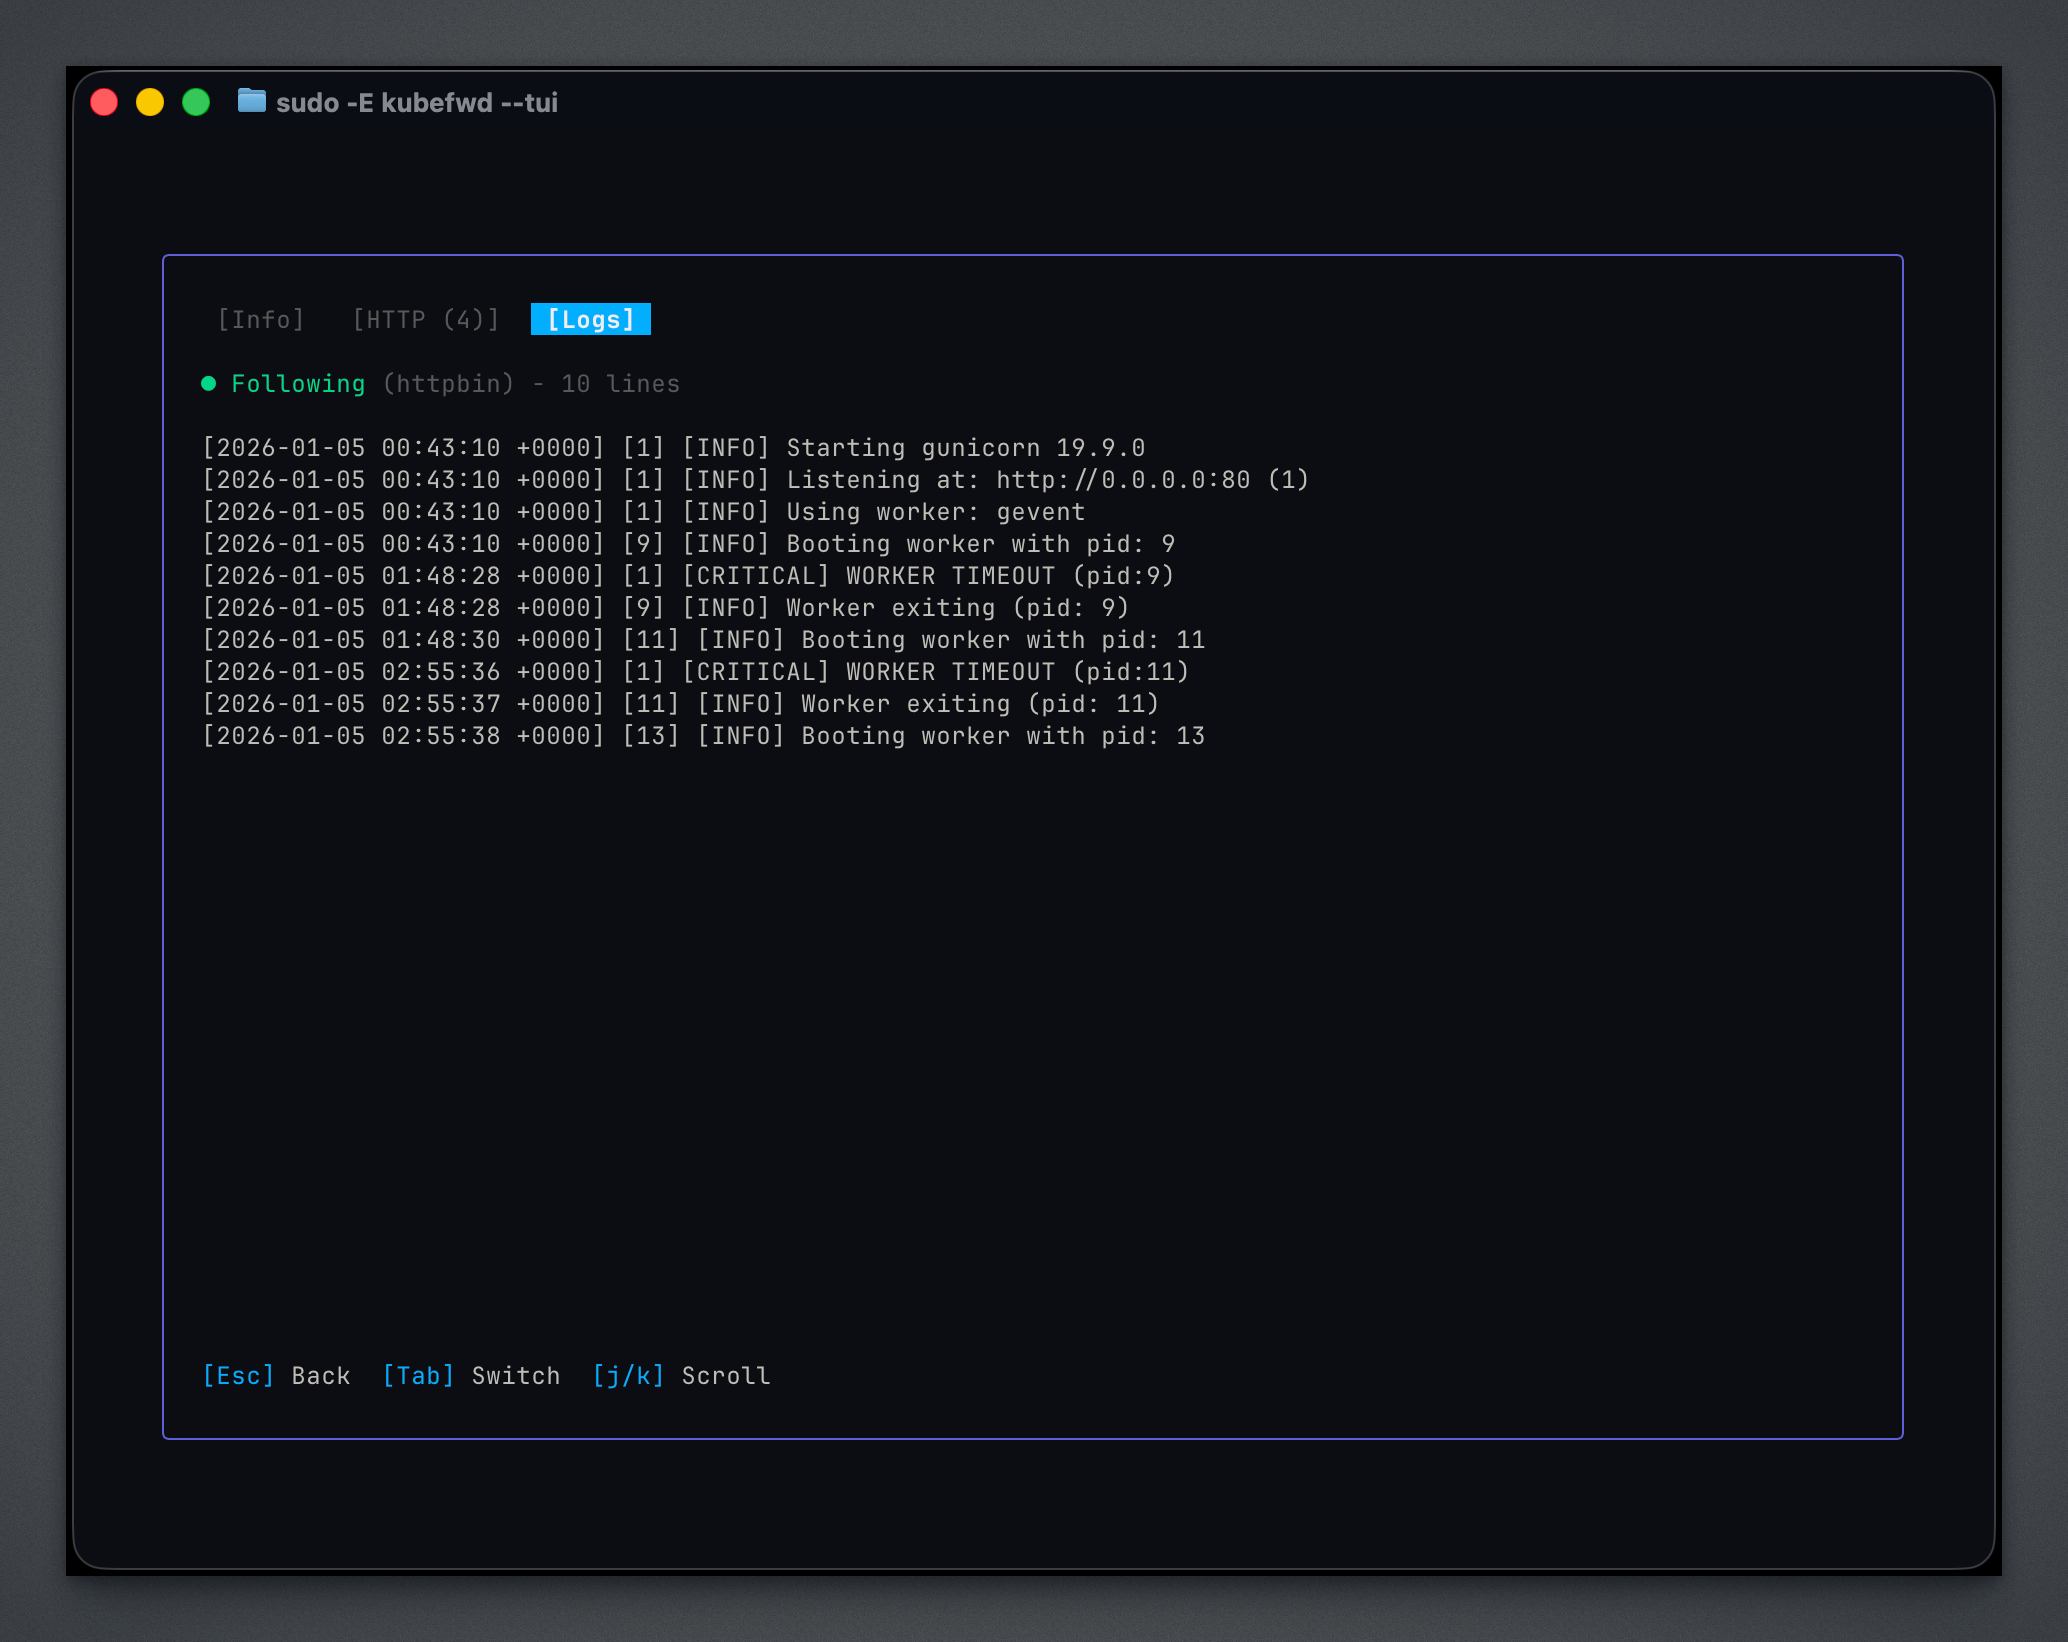
Logs stream in real-time from the pod backing the service. Use j/k to scroll through history.
HTTP Tab
Request tracing showing traffic flowing through the forward:
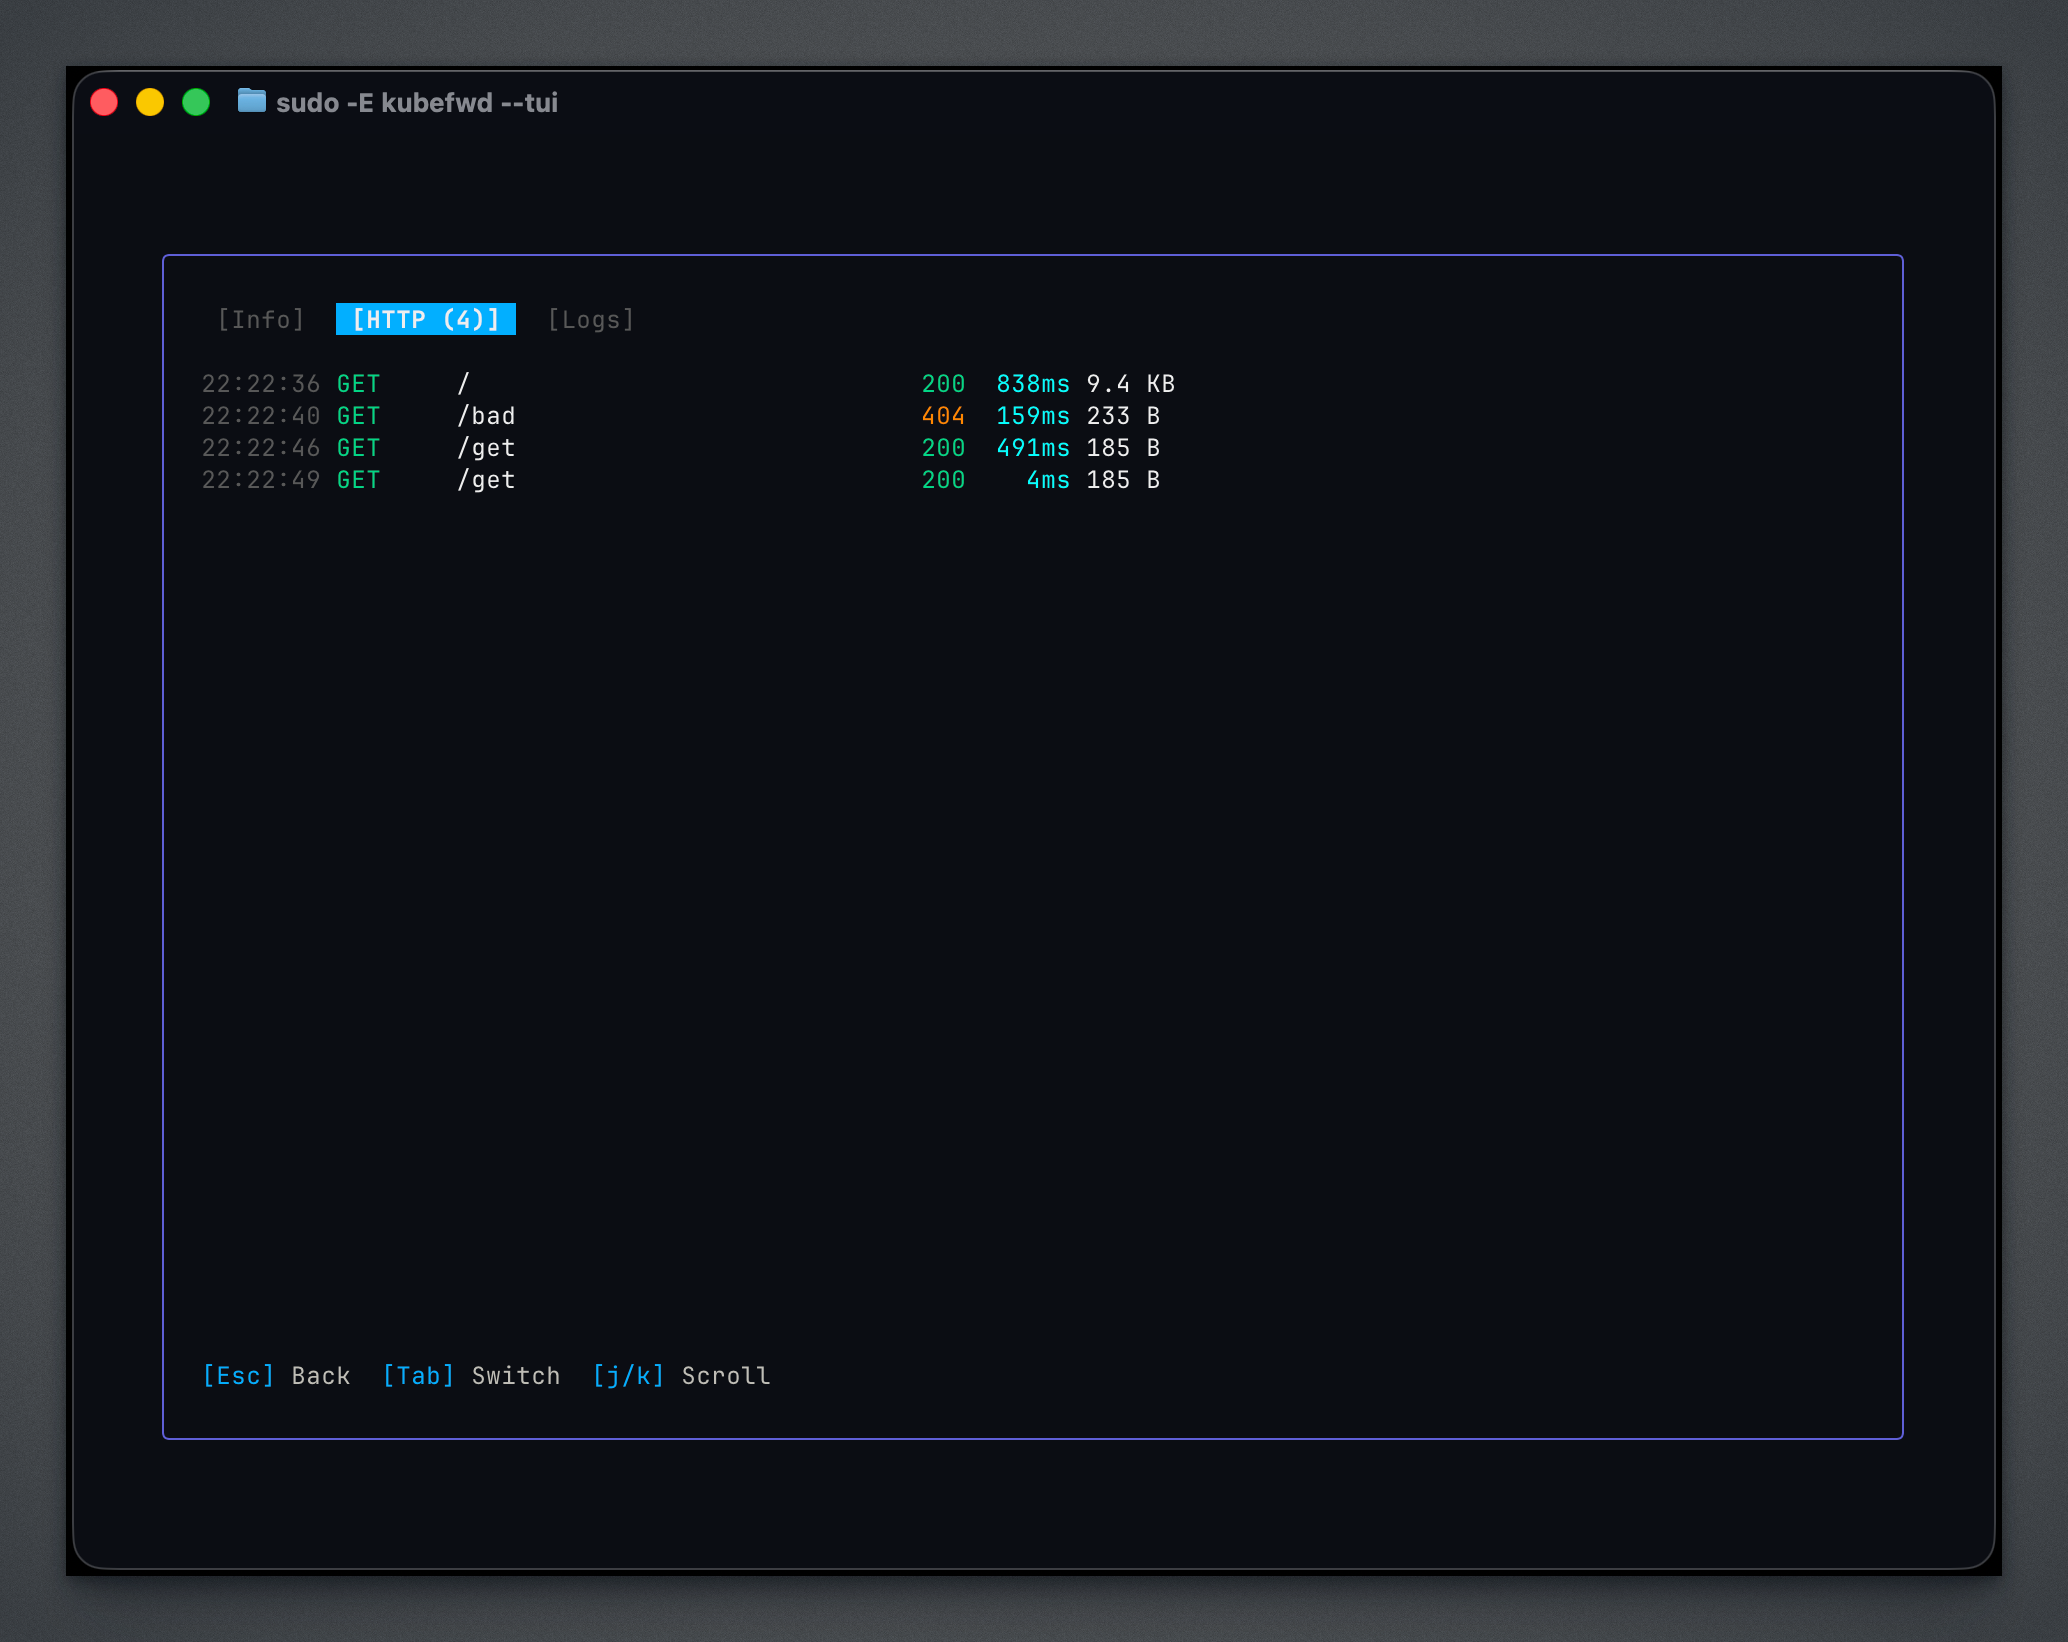
The HTTP tab shows requests detected flowing through HTTP-based forwards, including method, path, response code, latency, and response size.
Complete Keyboard Reference
Global
| Key | Action |
|---|---|
q |
Quit kubefwd |
? |
Toggle help overlay |
f |
Open namespace/service browser |
x |
Switch Kubernetes context |
/ |
Filter services |
Esc |
Clear filter / Close modal |
Navigation
| Key | Action |
|---|---|
j / ↓ |
Move down |
k / ↑ |
Move up |
g / Home |
Go to first item |
G / End |
Go to last item |
PgDn / PgUp |
Page down/up |
Tab |
Switch focus (services ↔ logs) |
Service Actions
| Key | Action |
|---|---|
Enter |
Open detail view for selected service |
d |
Remove forward for selected service |
r |
Reconnect all errored services |
R |
Force reconnect selected service |
Display
| Key | Action |
|---|---|
b |
Toggle bandwidth columns |
c |
Toggle compact view |
Detail View
| Key | Action |
|---|---|
1 - 9 |
Copy connection string #N to clipboard |
y |
Copy first connection string |
Tab / → |
Next tab |
Shift+Tab / ← |
Previous tab |
r |
Force reconnect this service |
Esc / q |
Close detail view |
Browser Modals
| Key | Action |
|---|---|
j / k |
Navigate list |
Space |
Toggle selection (service browser) |
a |
Select all (service browser) |
Enter |
Confirm selection |
Esc |
Close modal |
Auto-Reconnect
The TUI enables auto-reconnect by default. This provides dual-level reliability:
Level 1: Kubernetes Informers
kubefwd watches pod lifecycle events. When pods:
- Restart due to crashes
- Get rescheduled to different nodes
- Are replaced during deployments
kubefwd automatically detects the change and re-establishes the forward to the new pod.
Level 2: Connection Monitoring
For issues that don't trigger Kubernetes events:
- Network outages
- VPN reconnections
- Laptop sleep/wake cycles
kubefwd monitors TCP connections and reconnects with exponential backoff:
Press r to force immediate reconnection of all errored services.
Traffic Metrics
The TUI tracks traffic for each forwarded service:
| Metric | Description |
|---|---|
| Bytes In | Total data received from cluster |
| Bytes Out | Total data sent to cluster |
| Rate | Current transfer speed (bytes/sec) |
| Sparkline | Visual graph of recent activity |
Toggle bandwidth columns with b to save screen space.
Filtering Services
Press / to enter filter mode:
- Type your filter text
- Press
Enterto apply - Press
Escto clear
Filters match against:
- Service name
- Namespace
- Status (e.g., "error", "active")
Examples:
| Filter | Matches |
|---|---|
api |
Services containing "api" |
staging |
Services in namespaces containing "staging" |
error |
Services with connection errors |
postgres |
All postgres services |
Mouse Support
The TUI supports mouse interaction:
- Scroll wheel: Navigate lists and scroll content
- Click: Select services
- Shift+drag: Select text for copying
Terminal Requirements
For the best experience:
- Colors: Terminal with 256-color support
- Size: Minimum 80×24, wider is better for traffic sparklines
- Encoding: UTF-8 for special characters
Recommended Terminals
| Platform | Terminals |
|---|---|
| macOS | iTerm2, Terminal.app, Alacritty, kitty |
| Linux | GNOME Terminal, Konsole, Alacritty, kitty |
| Windows | Windows Terminal, ConEmu |
Tips
-
Start in Idle Mode: Use
sudo -E kubefwd --tuiand add services as needed rather than forwarding everything upfront. -
Use the browser: Press
fto explore namespaces and services visually instead of remembering names. -
Copy connection strings: In detail view, press
1-9to copy ready-to-use connection commands. -
Watch the logs panel: Issues often appear in logs before they affect your work.
-
Filter early: Use
/to focus on services you're actively debugging. -
Wide terminals: More room means better traffic sparklines and service details.
-
Context switching: Press
xto work with multiple clusters without restarting kubefwd.