TUI Guide
The Terminal User Interface (TUI) provides real-time monitoring and control of all your forwarded services.
Launching the TUI
The TUI automatically enables --auto-reconnect for resilient port forwarding.
Interface Overview
The TUI is divided into several panels:
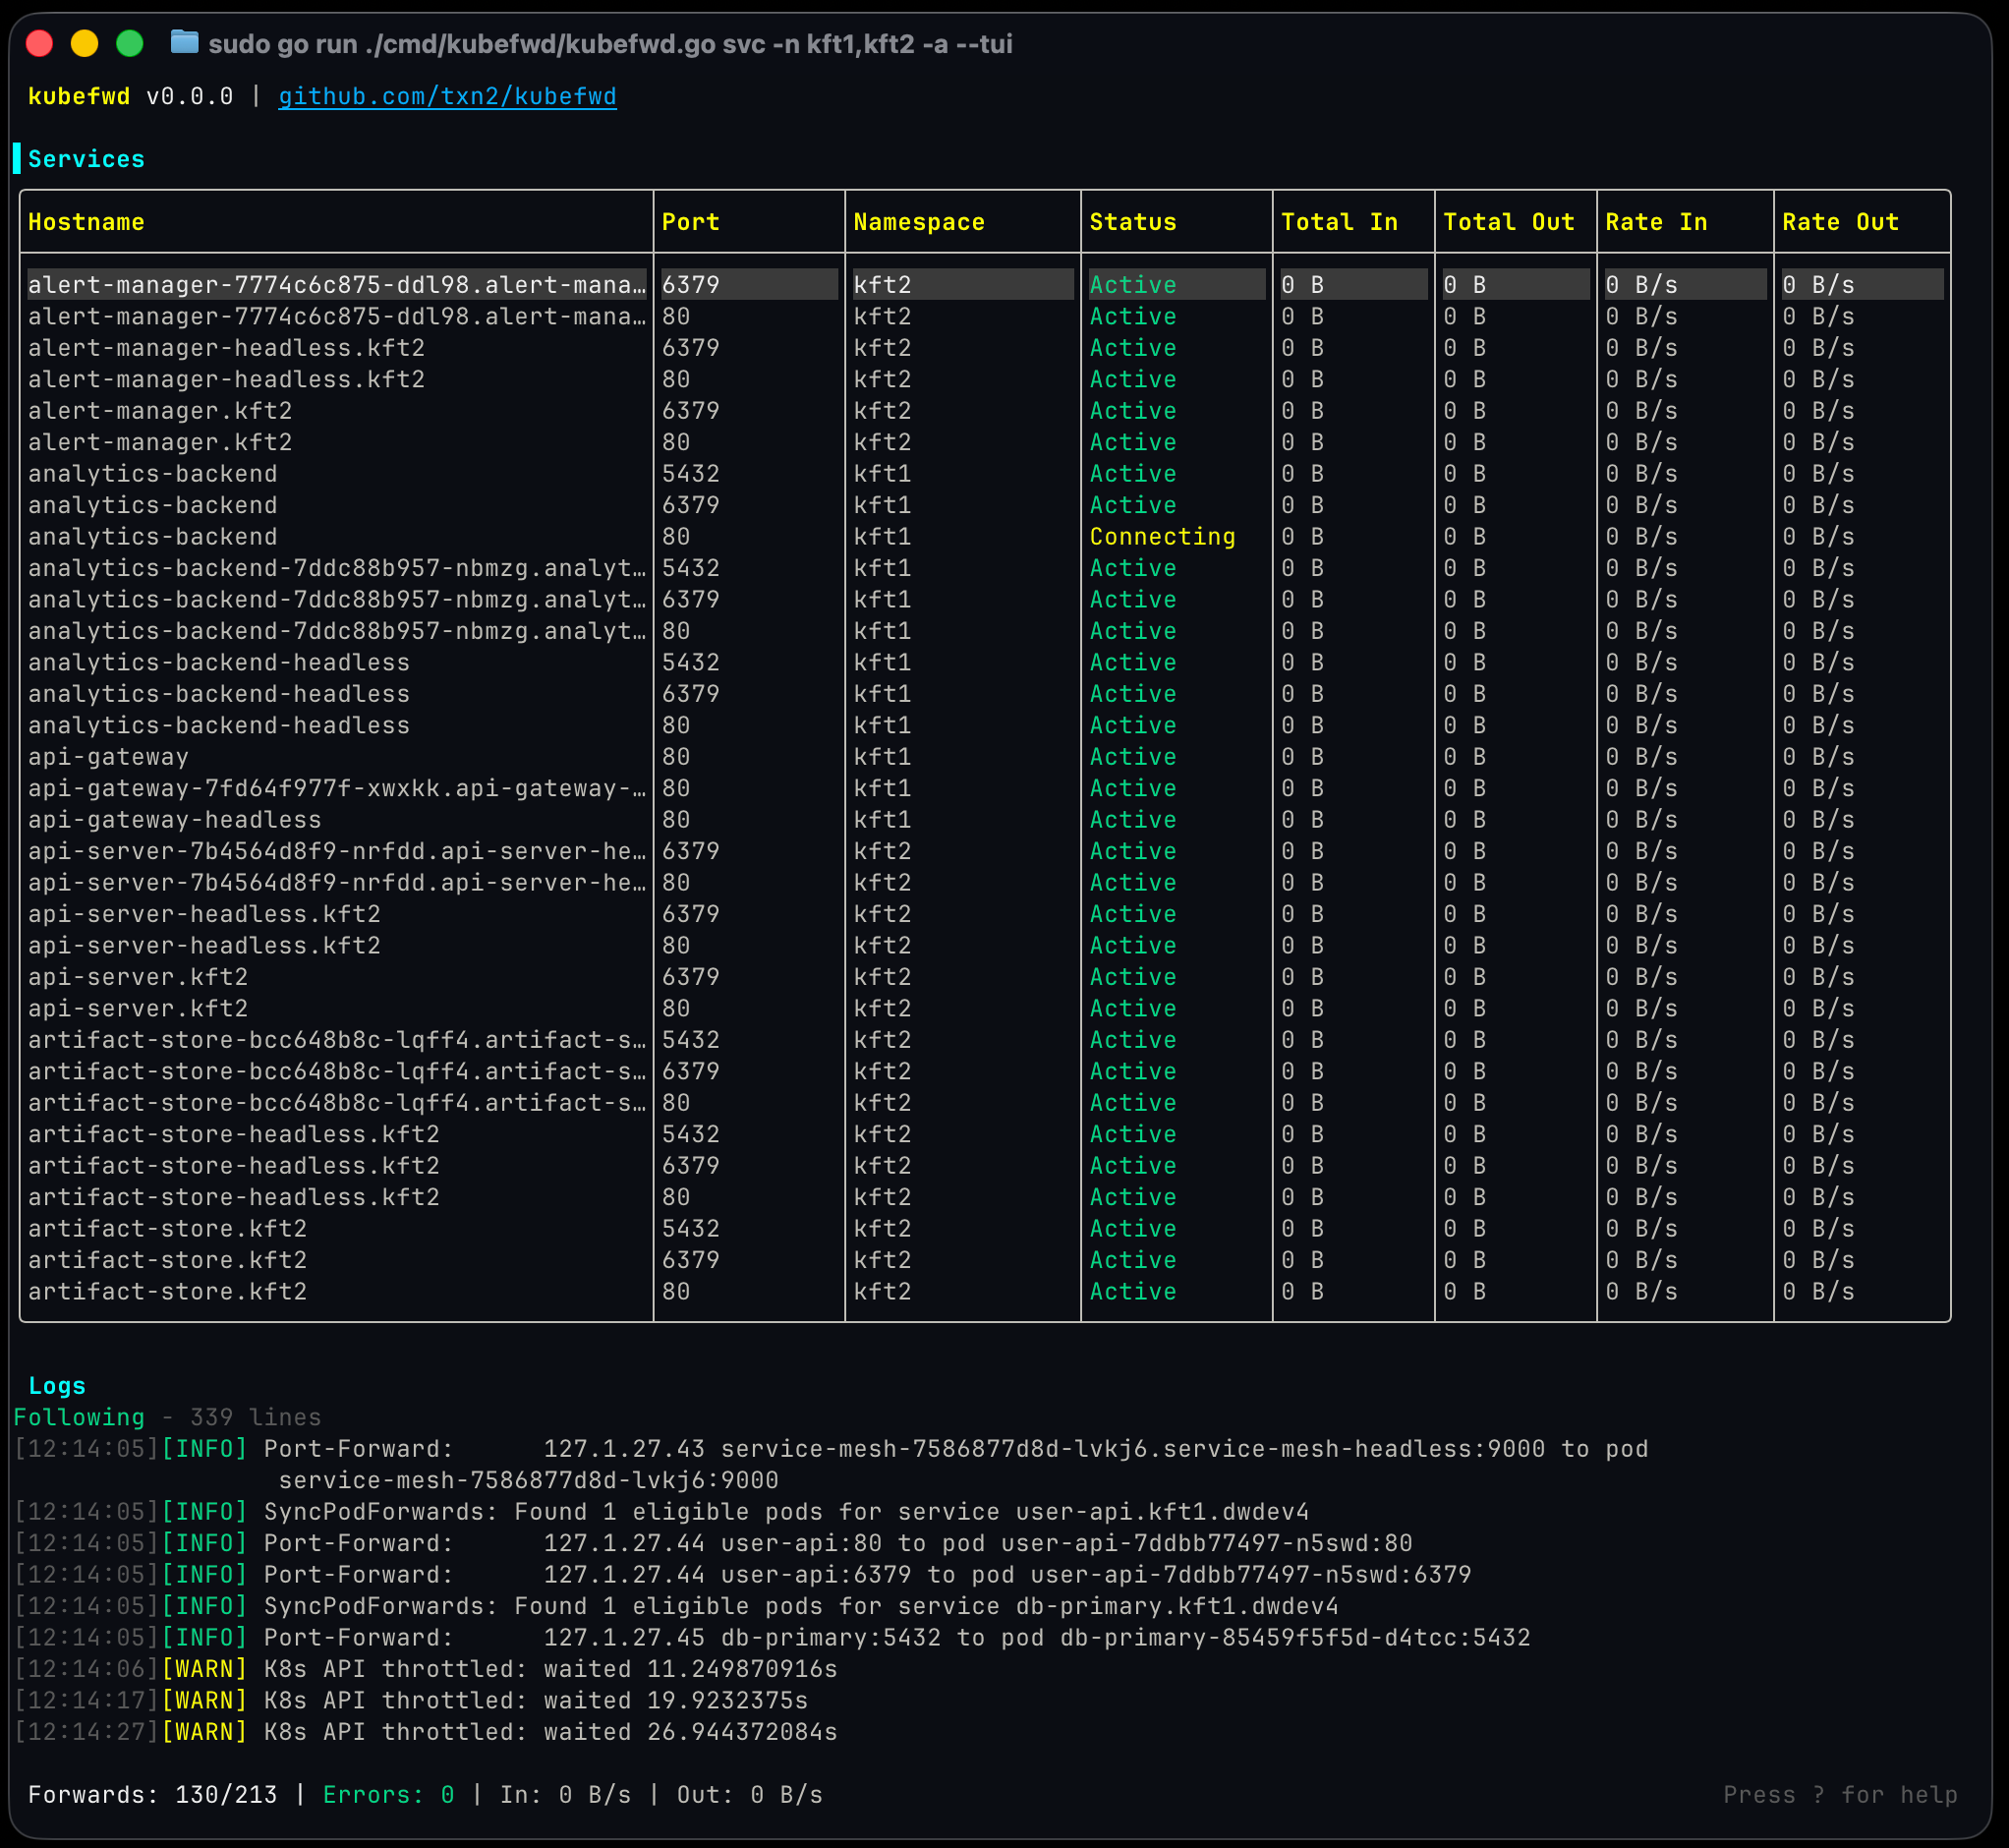
Services Panel (Top)
Displays all forwarded services with:
- Status indicator: Colored dot showing connection state
- Green: Active and forwarding
- Yellow: Connecting/reconnecting
- Red: Error state
- Service name: The Kubernetes service name
- Namespace: Which namespace the service belongs to
- Local address: The 127.x.x.x:port assigned
- Traffic metrics: Bytes in/out with sparkline graphs (toggle with b)
Logs Panel (Bottom)
Shows real-time kubefwd activity: - Service discovery events - Connection status changes - Error messages - Pod lifecycle events
Status Bar (Bottom)
Displays: - Total services forwarded - Active/error counts - Current filter (if any) - Keyboard hints
Keyboard Shortcuts
Navigation
| Key | Action |
|---|---|
j / ↓ |
Move down / scroll |
k / ↑ |
Move up / scroll |
g / Home |
Go to first item |
G / End |
Go to last item |
PgDn / PgUp |
Page down/up |
Tab |
Switch focus between services and logs |
Actions
| Key | Action |
|---|---|
Enter |
Open detail view for selected service |
r |
Reconnect all errored services |
/ |
Start filtering services |
Esc |
Clear filter / Close detail view |
? |
Toggle help overlay |
q |
Quit kubefwd |
Display Options
| Key | Action |
|---|---|
b |
Toggle bandwidth columns |
c |
Toggle compact view |
Detail View
Press Enter on any service to open the detail view:
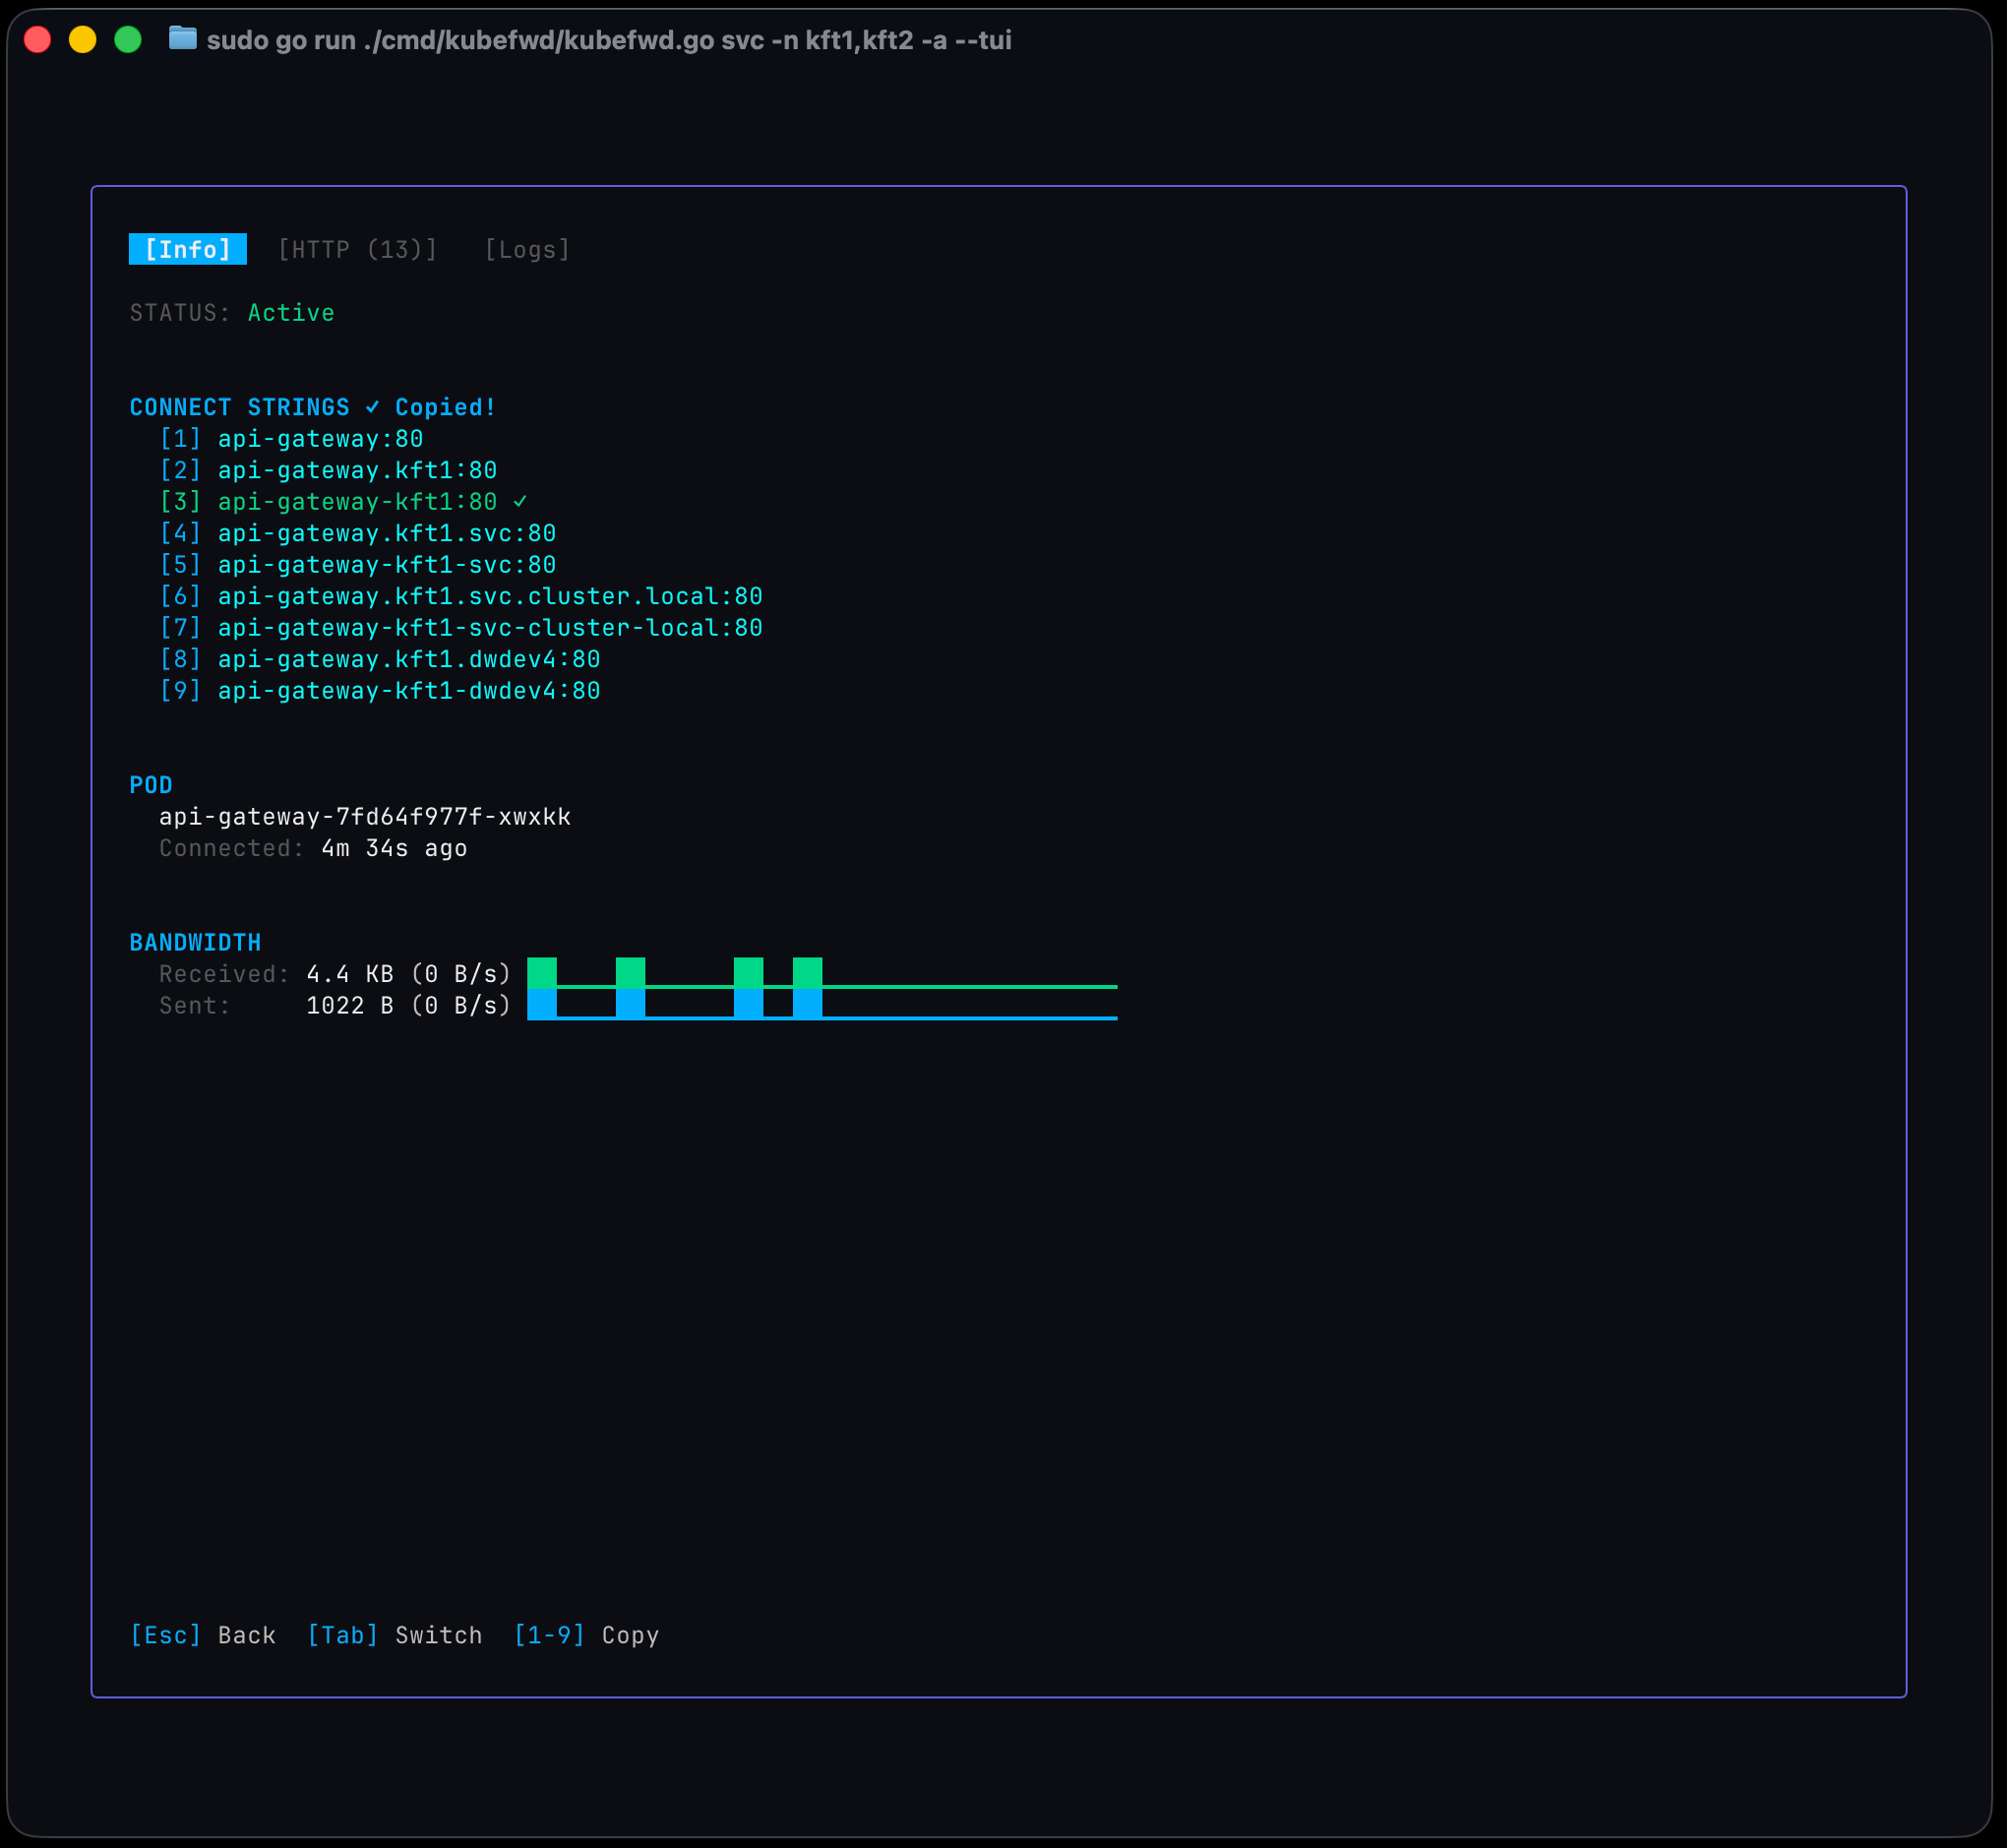
Tabs
Use Tab or Shift+Tab to switch between tabs:
- Info: Connection details, copy-able addresses, and bandwidth sparklines
- HTTP: HTTP request/response activity (shown with request count)
- Logs: Pod logs from the forwarded container
Detail View Shortcuts
| Key | Action |
|---|---|
Esc / q |
Close detail view |
Tab / → |
Next tab |
Shift+Tab / ← |
Previous tab |
1-9 |
Copy connect string #N to clipboard |
y |
Yank (copy) first connect string |
j / k |
Scroll content |
h |
Toggle HTTP requests display |
r |
Force reconnect this service |
Connect Strings
The Info tab shows ready-to-use connection strings:
Press the corresponding number to copy to clipboard.
Traffic Metrics
The TUI tracks traffic for each forwarded service:
- Bytes In/Out: Total data transferred
- Rate: Current transfer speed (bytes/sec)
- Sparkline: Visual graph of recent activity
Toggle bandwidth columns with b if you need more screen space.
Filtering Services
Press / to enter filter mode:
- Type your filter text (matches service name, namespace, or status)
- Press
Enterto apply - Press
Escto clear filter
Filter examples:
- api - Show services containing "api"
- prod - Show services in namespaces containing "prod"
- error - Show services with connection errors
Auto-Reconnect
When running with --tui, auto-reconnect is enabled by default. This means:
- Lost connections automatically retry with exponential backoff
- Pod restarts trigger automatic re-forwarding
- Service updates are detected and applied
Backoff timing: 1s → 2s → 4s → 8s → ... → 5min (max)
Press r to force immediate reconnection of all errored services.
Mouse Support
The TUI supports mouse interaction:
- Scroll wheel: Navigate lists and scroll content
- Click: Select services (when enabled)
- Shift+drag: Select text for copying
Terminal Requirements
For best results: - Use a terminal that supports 256 colors - Minimum 80x24 terminal size recommended - UTF-8 encoding for special characters
Recommended Terminals
- macOS: iTerm2, Terminal.app, Alacritty
- Linux: GNOME Terminal, Konsole, Alacritty, kitty
- Windows: Windows Terminal, ConEmu
Tips
- Wide terminals: More room for traffic sparklines and service details
- Tall terminals: See more services and log lines without scrolling
- Filter early: Use
/to focus on services you're debugging - Copy connect strings: Use
1-9in detail view for quick clipboard access - Watch the logs: The logs panel shows issues before they affect your work